New Habits, Old Habits
It's been a busy month. Spring's sprung, my second data vis class ended (and my third started), and I've picked up a few more habits to help me build some skills. Here's what you might have missed:
Mind-mapping Fridays
A little over a month ago I dropped my Windows phone on my bike ride home from work. Shattered into a million billion little pieces, I dreaded the thought of a new phone - I'd grown used to having limited functionality - it was like having a flip phone that was only good for the essentials: getting calls, sending texts, and occasionally checking mail. Despite ample peer pressure to go the iPhone route, I opted for a shiny new Android phone - and my world sort of opened. Or rather, I returned to this century and finally had access to all manner of apps I'd not known existed.
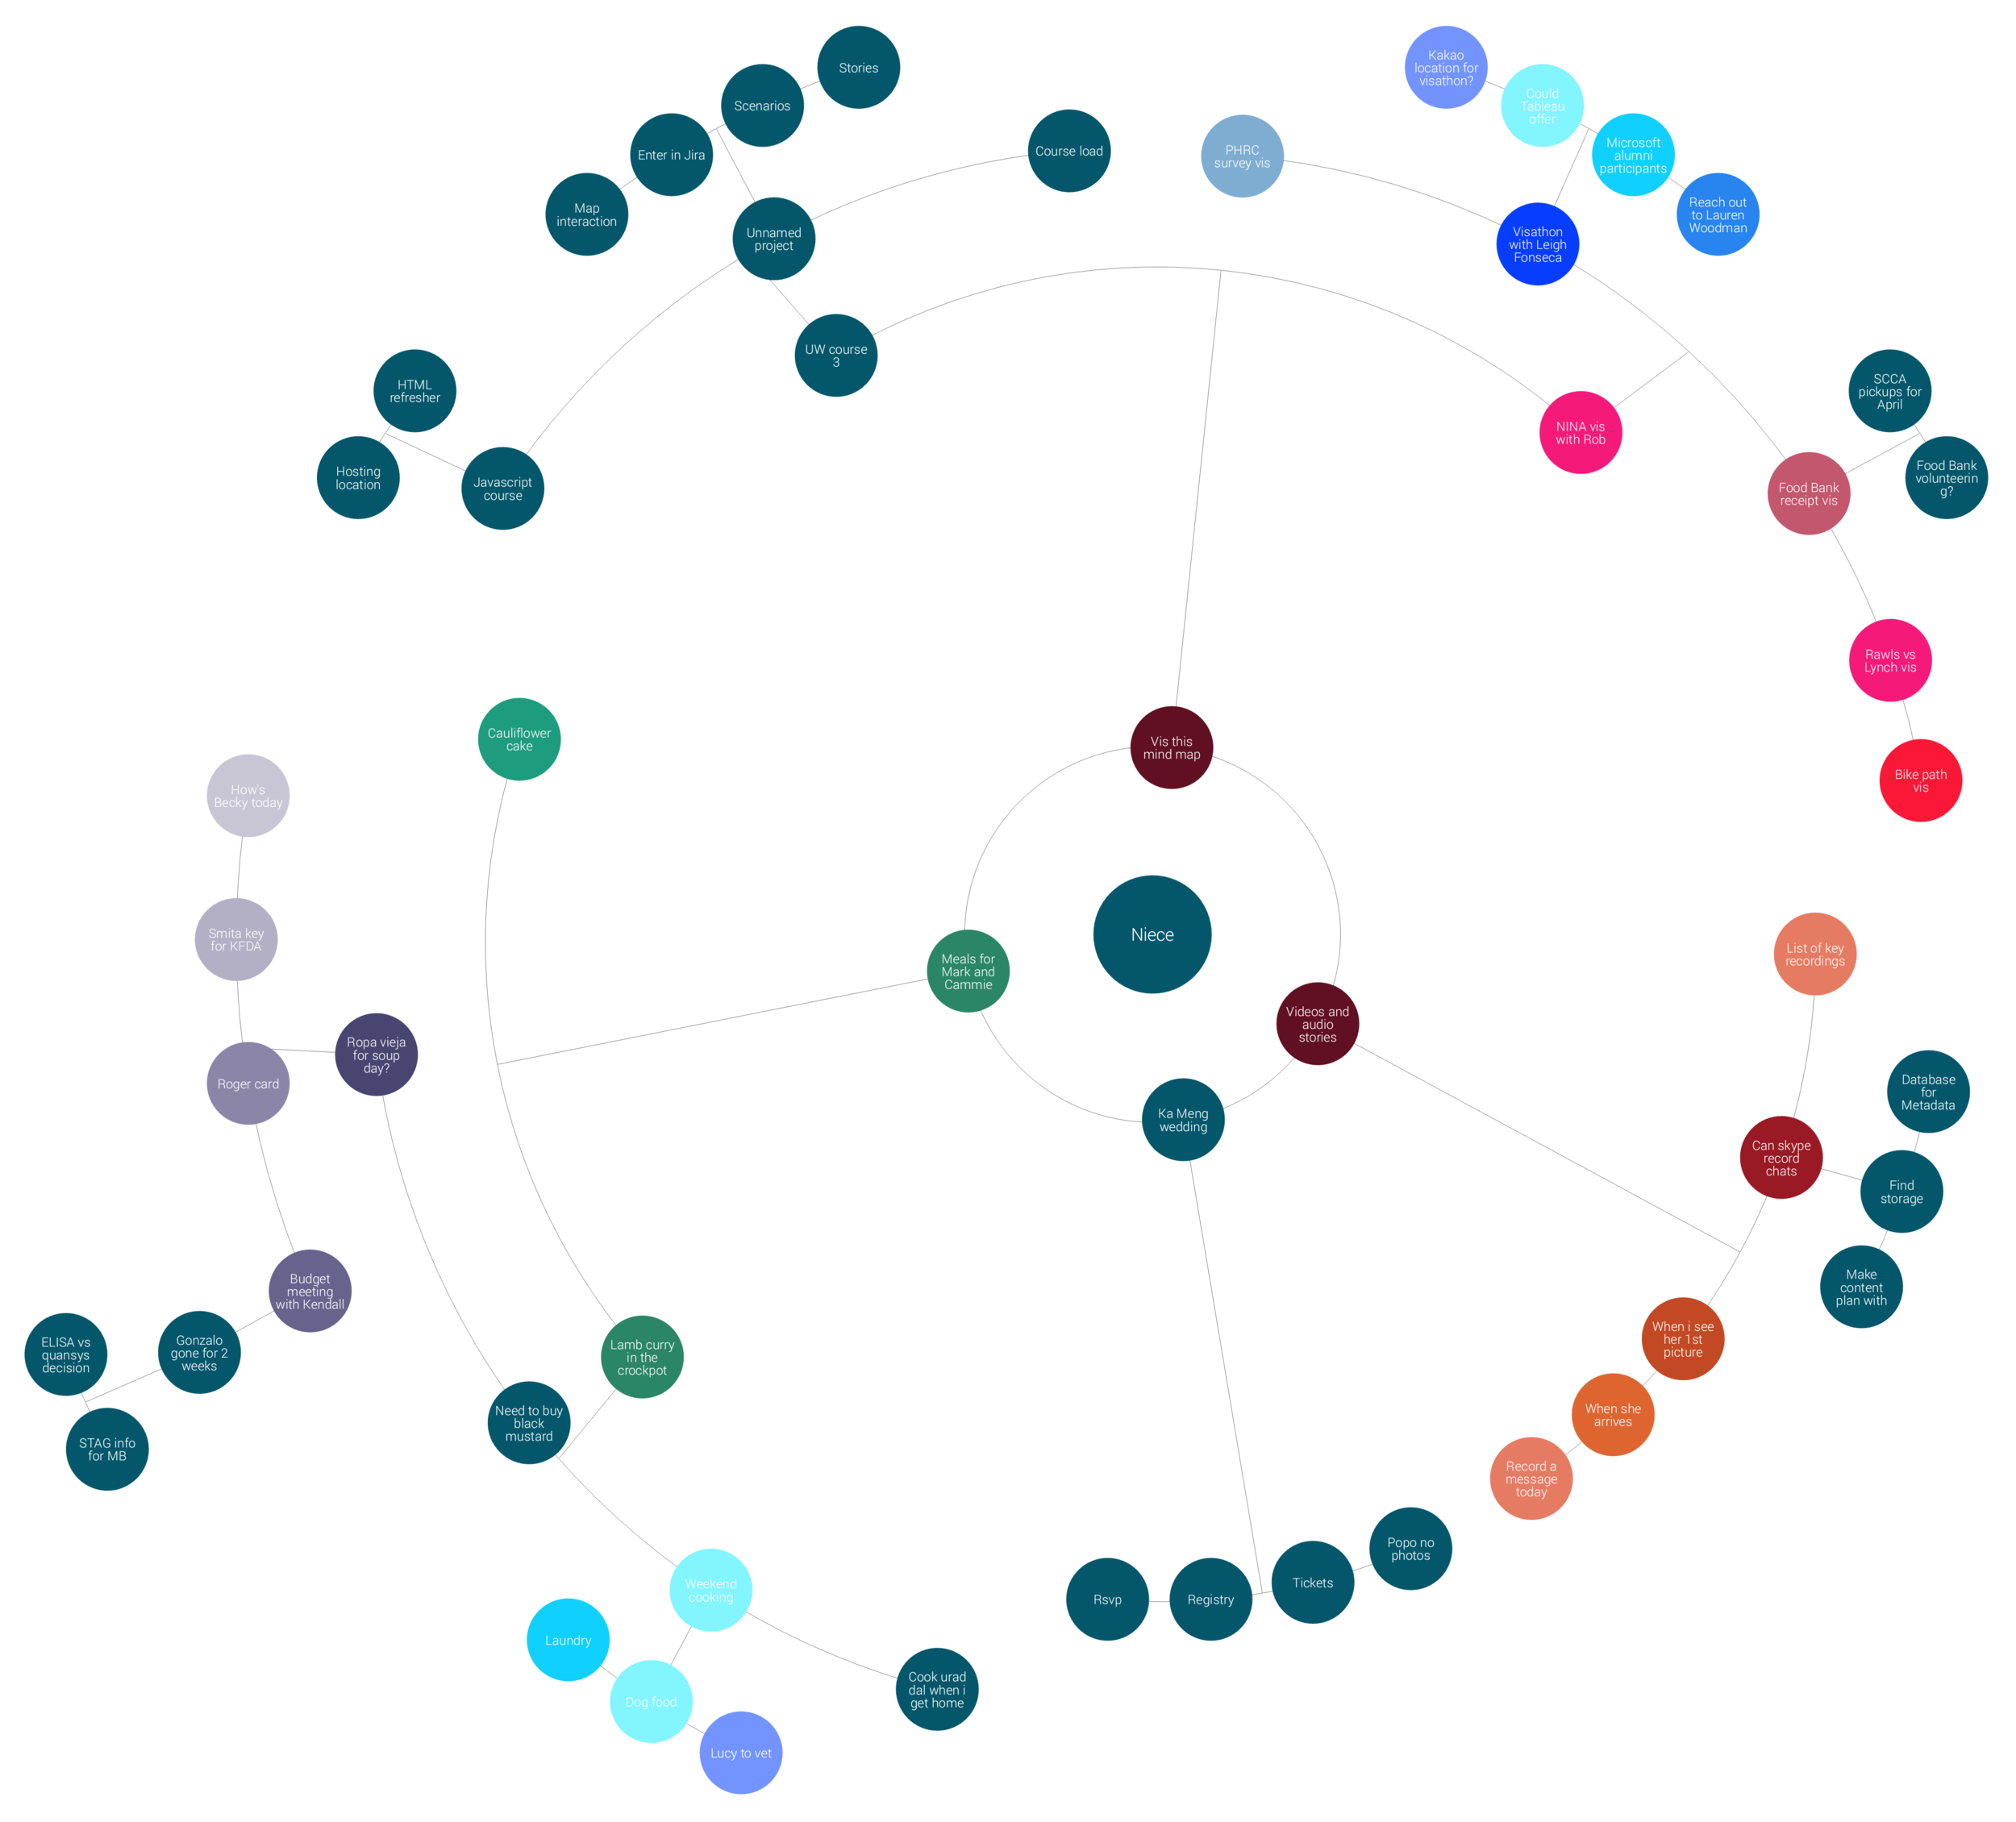
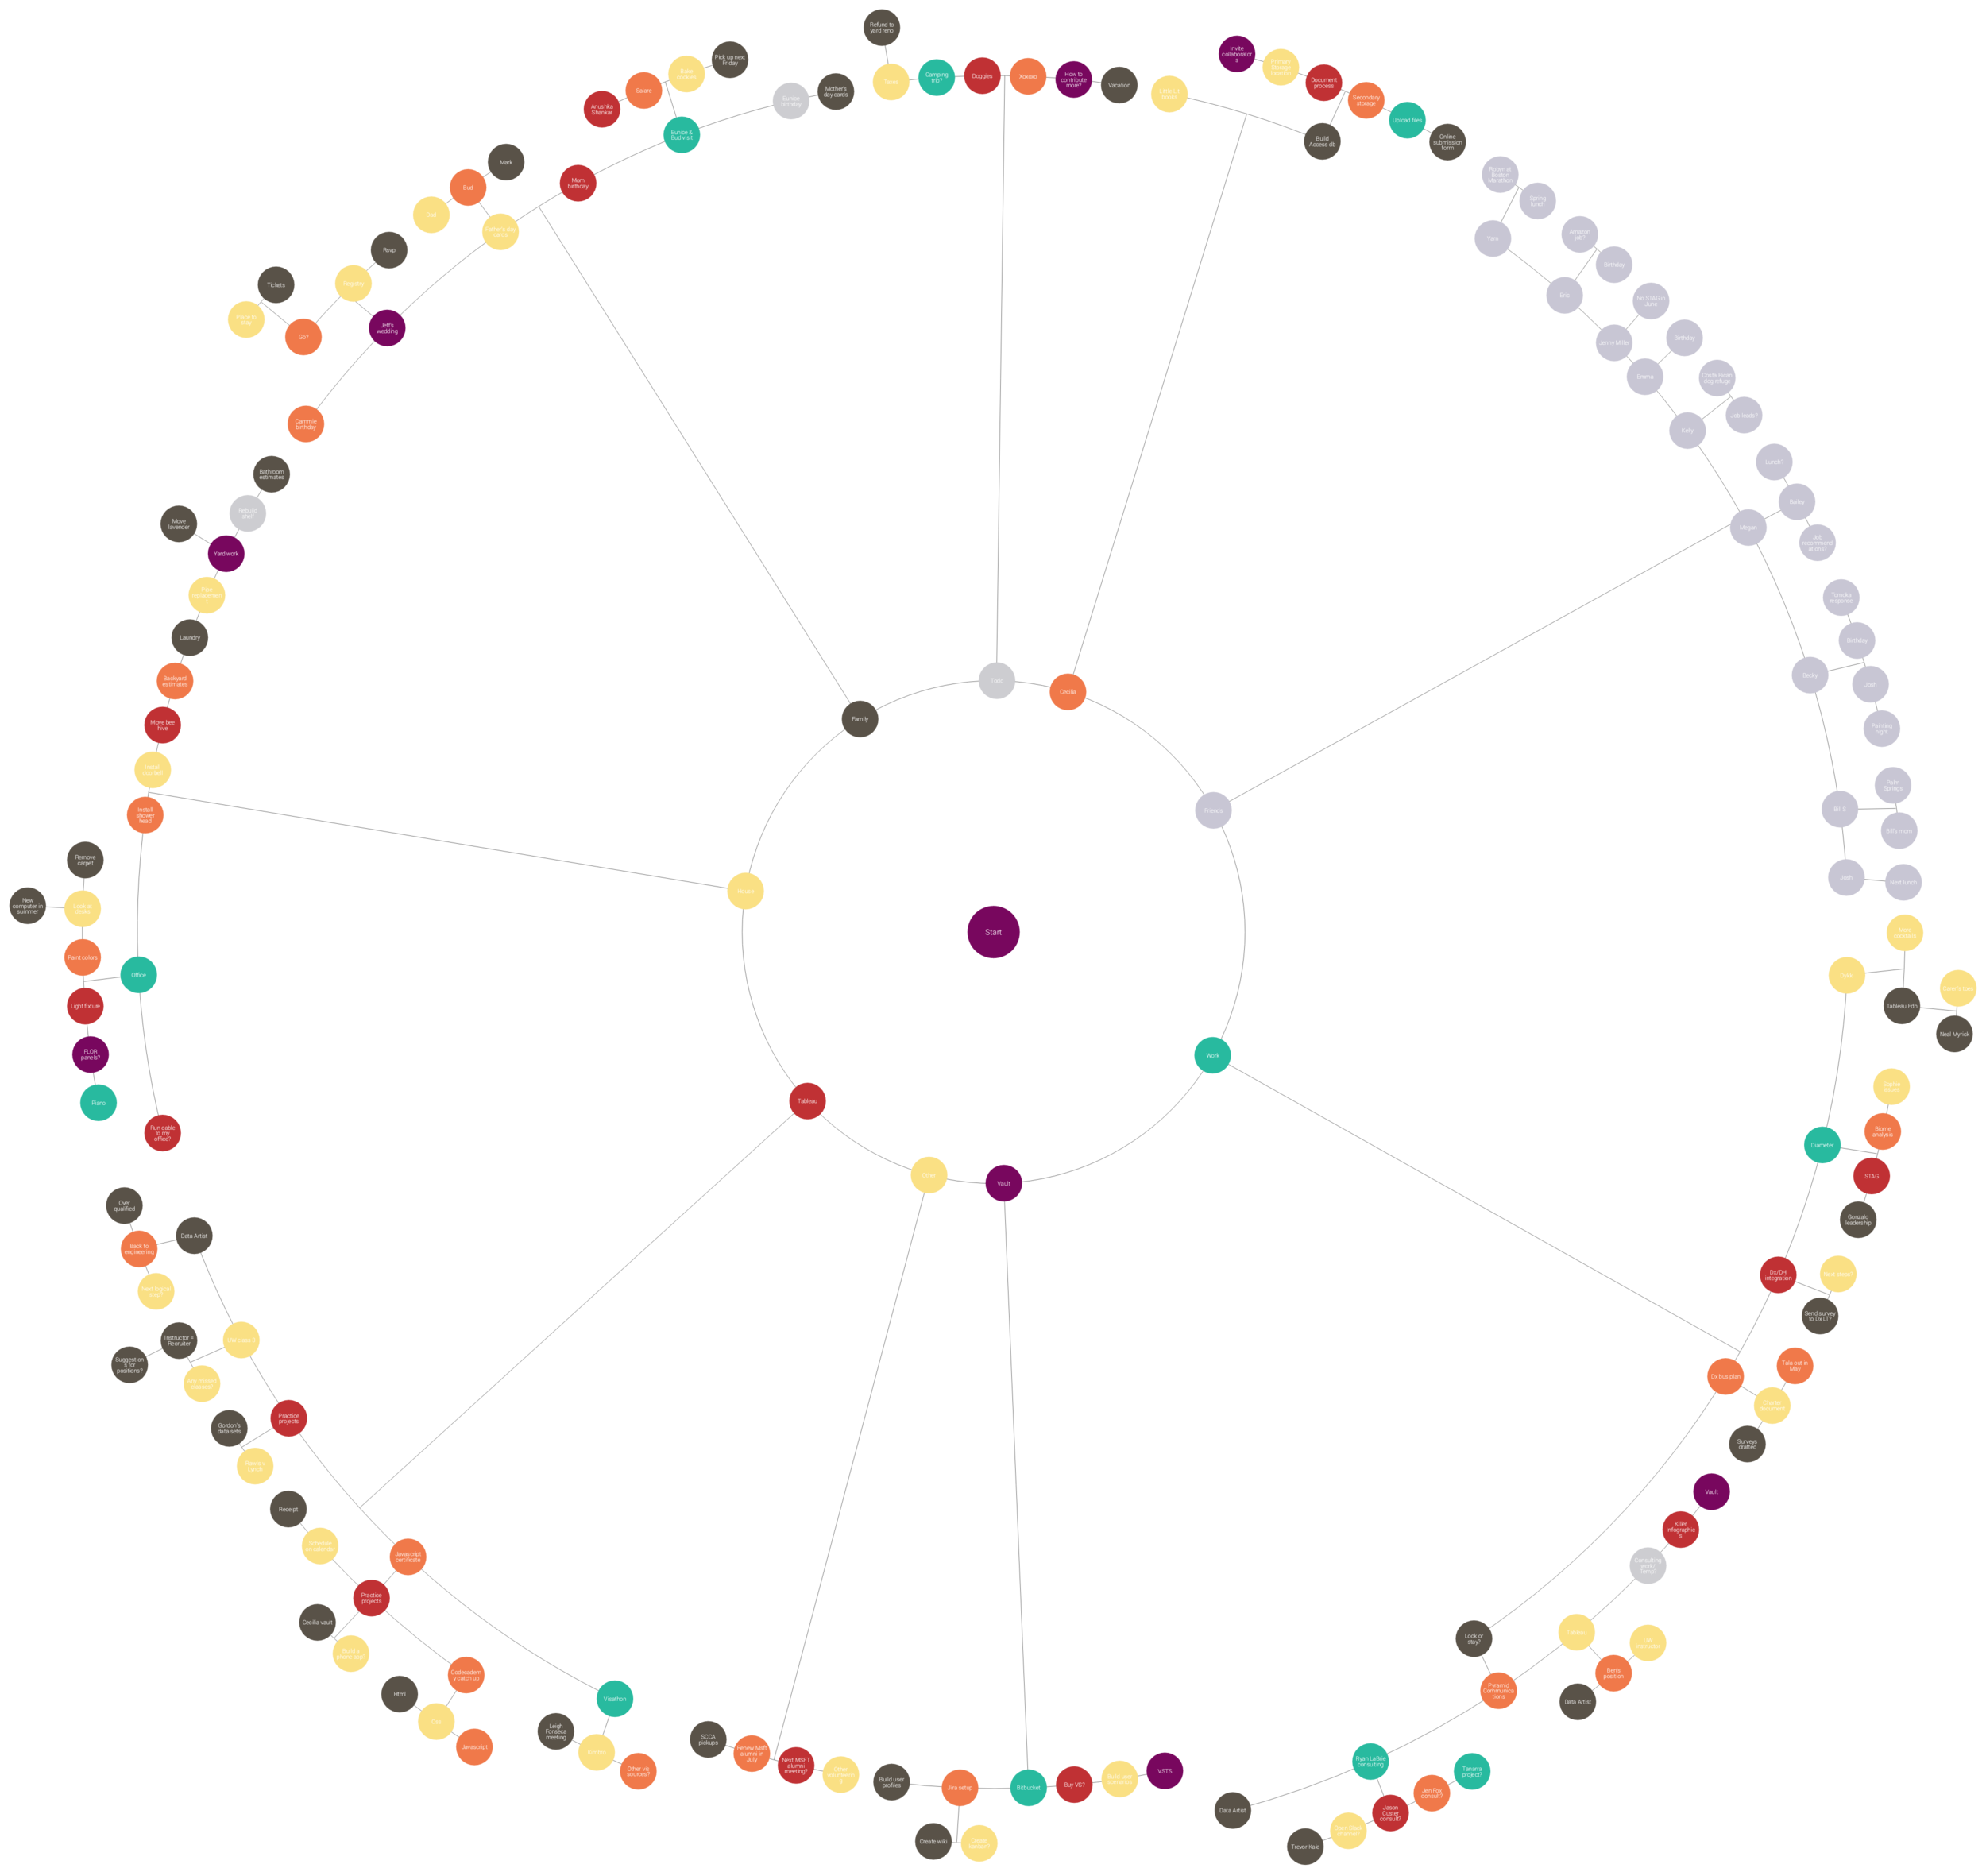
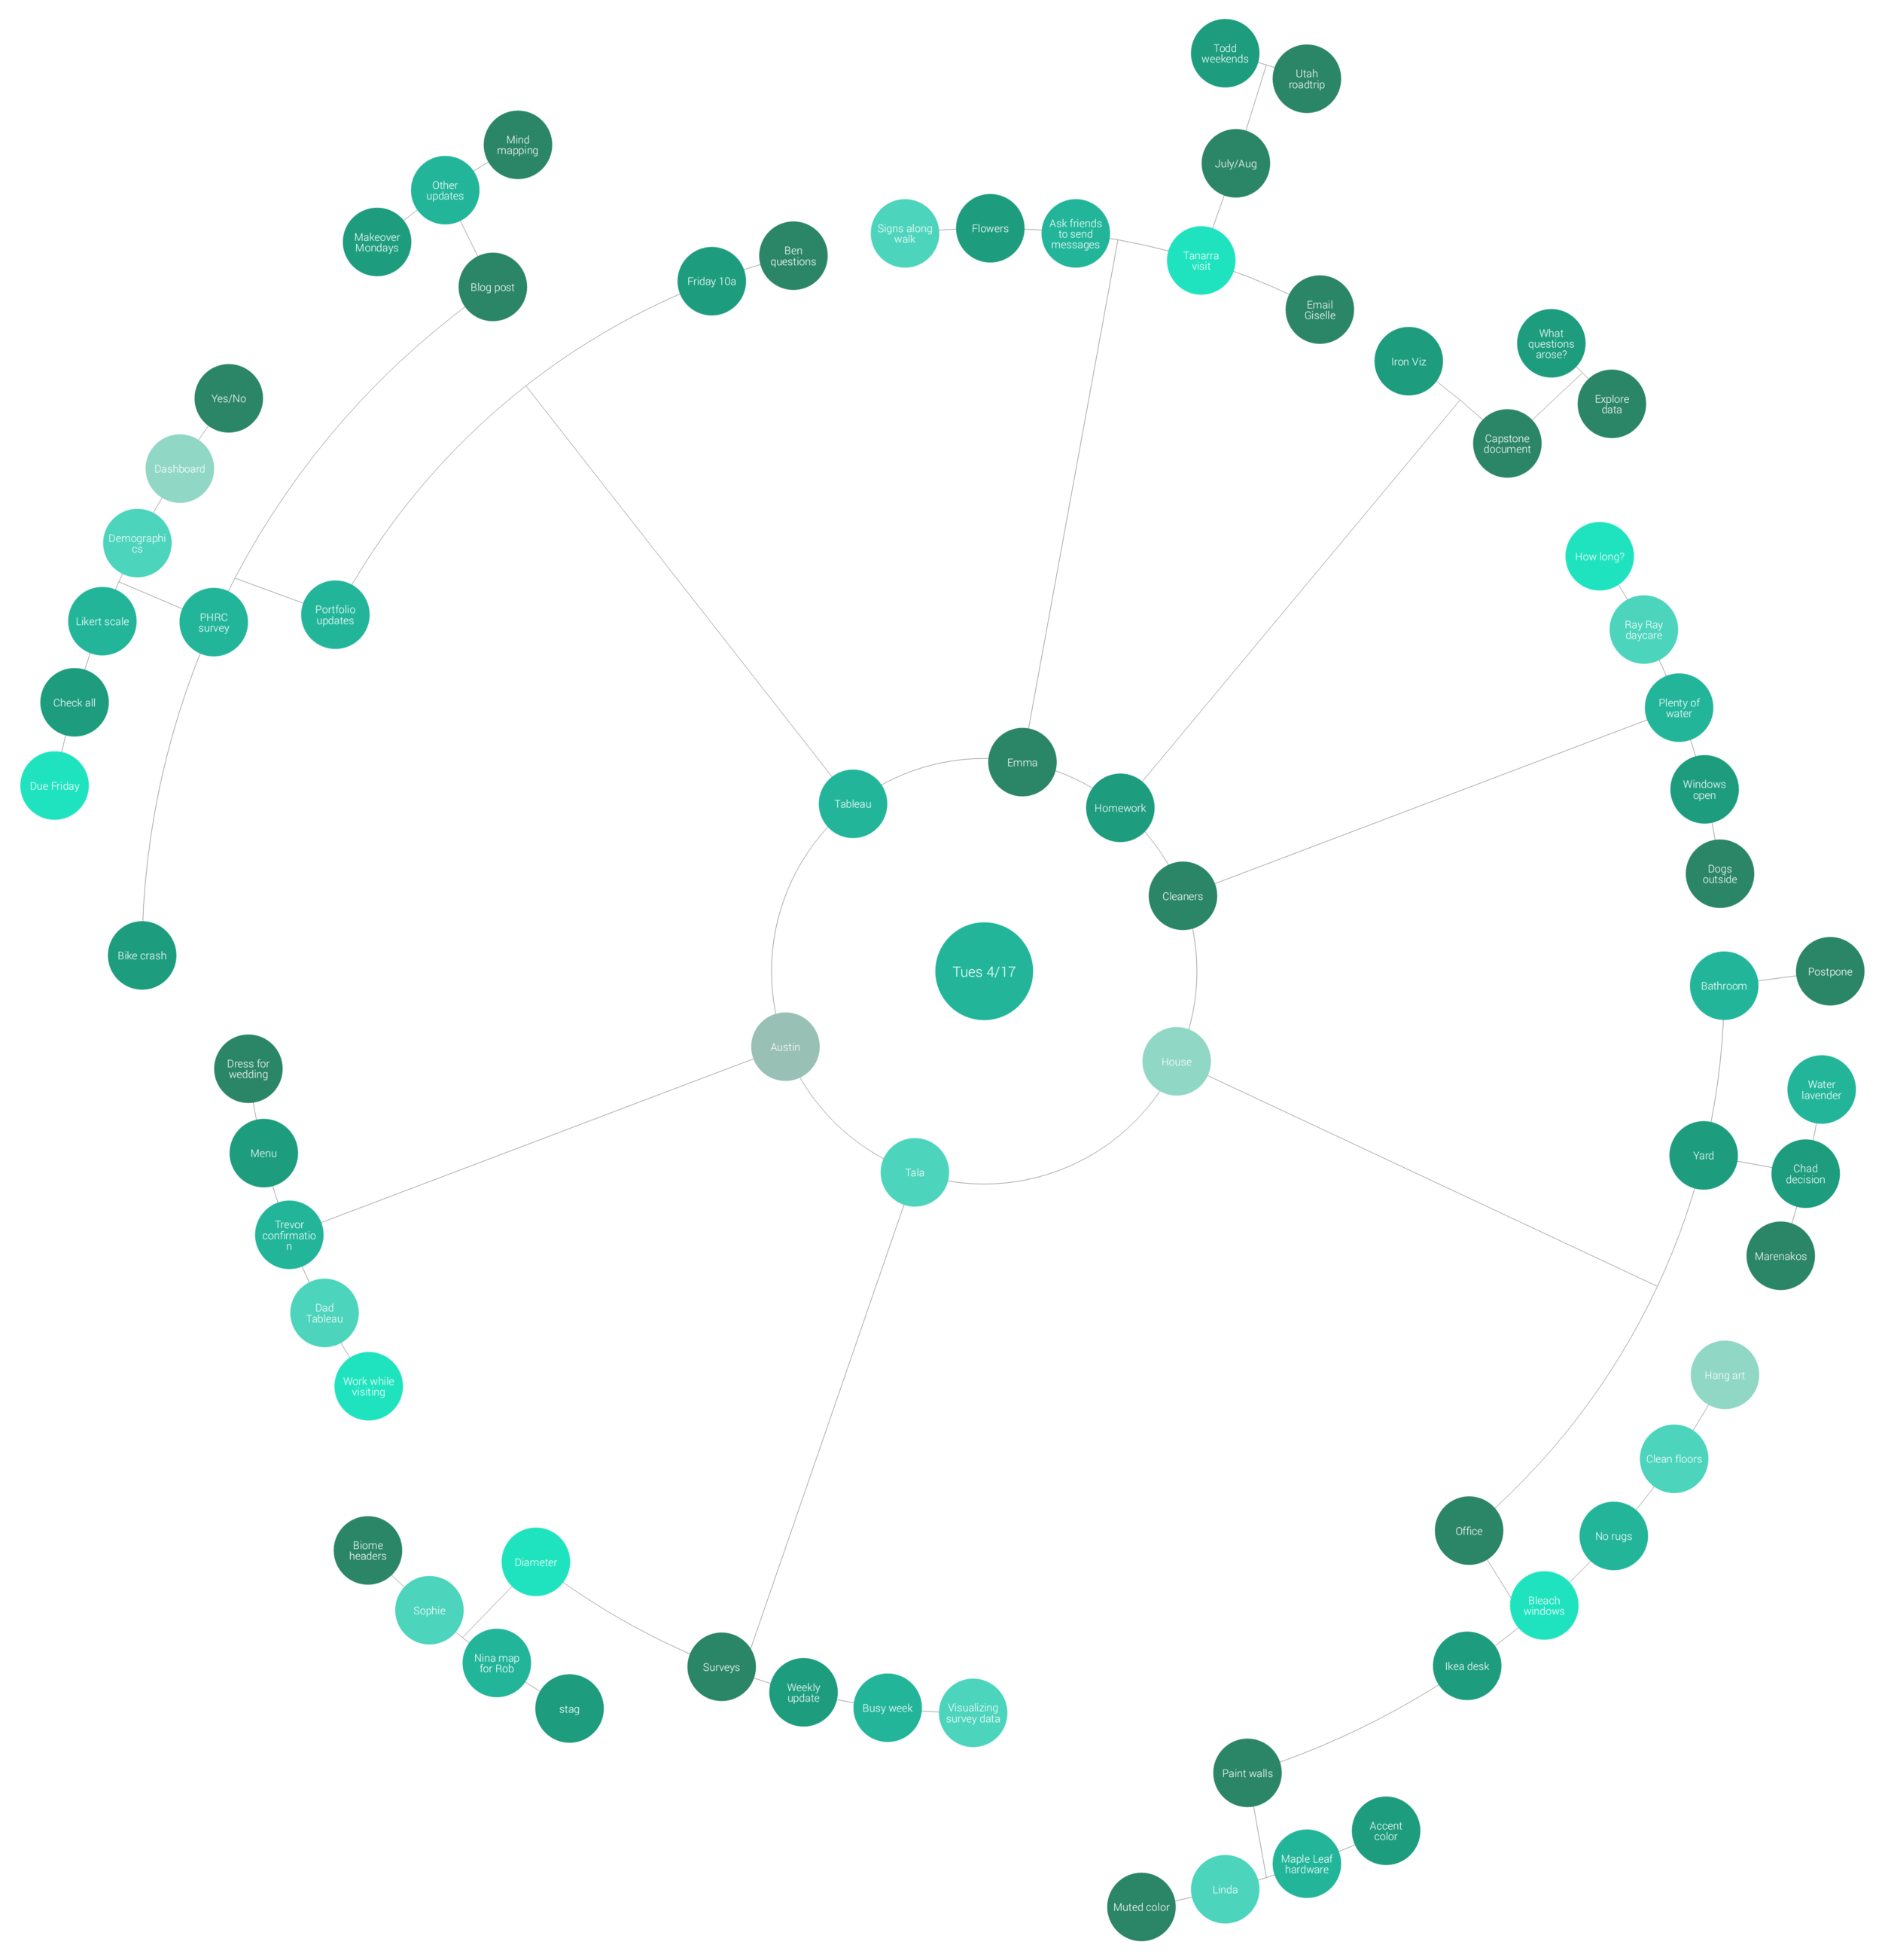
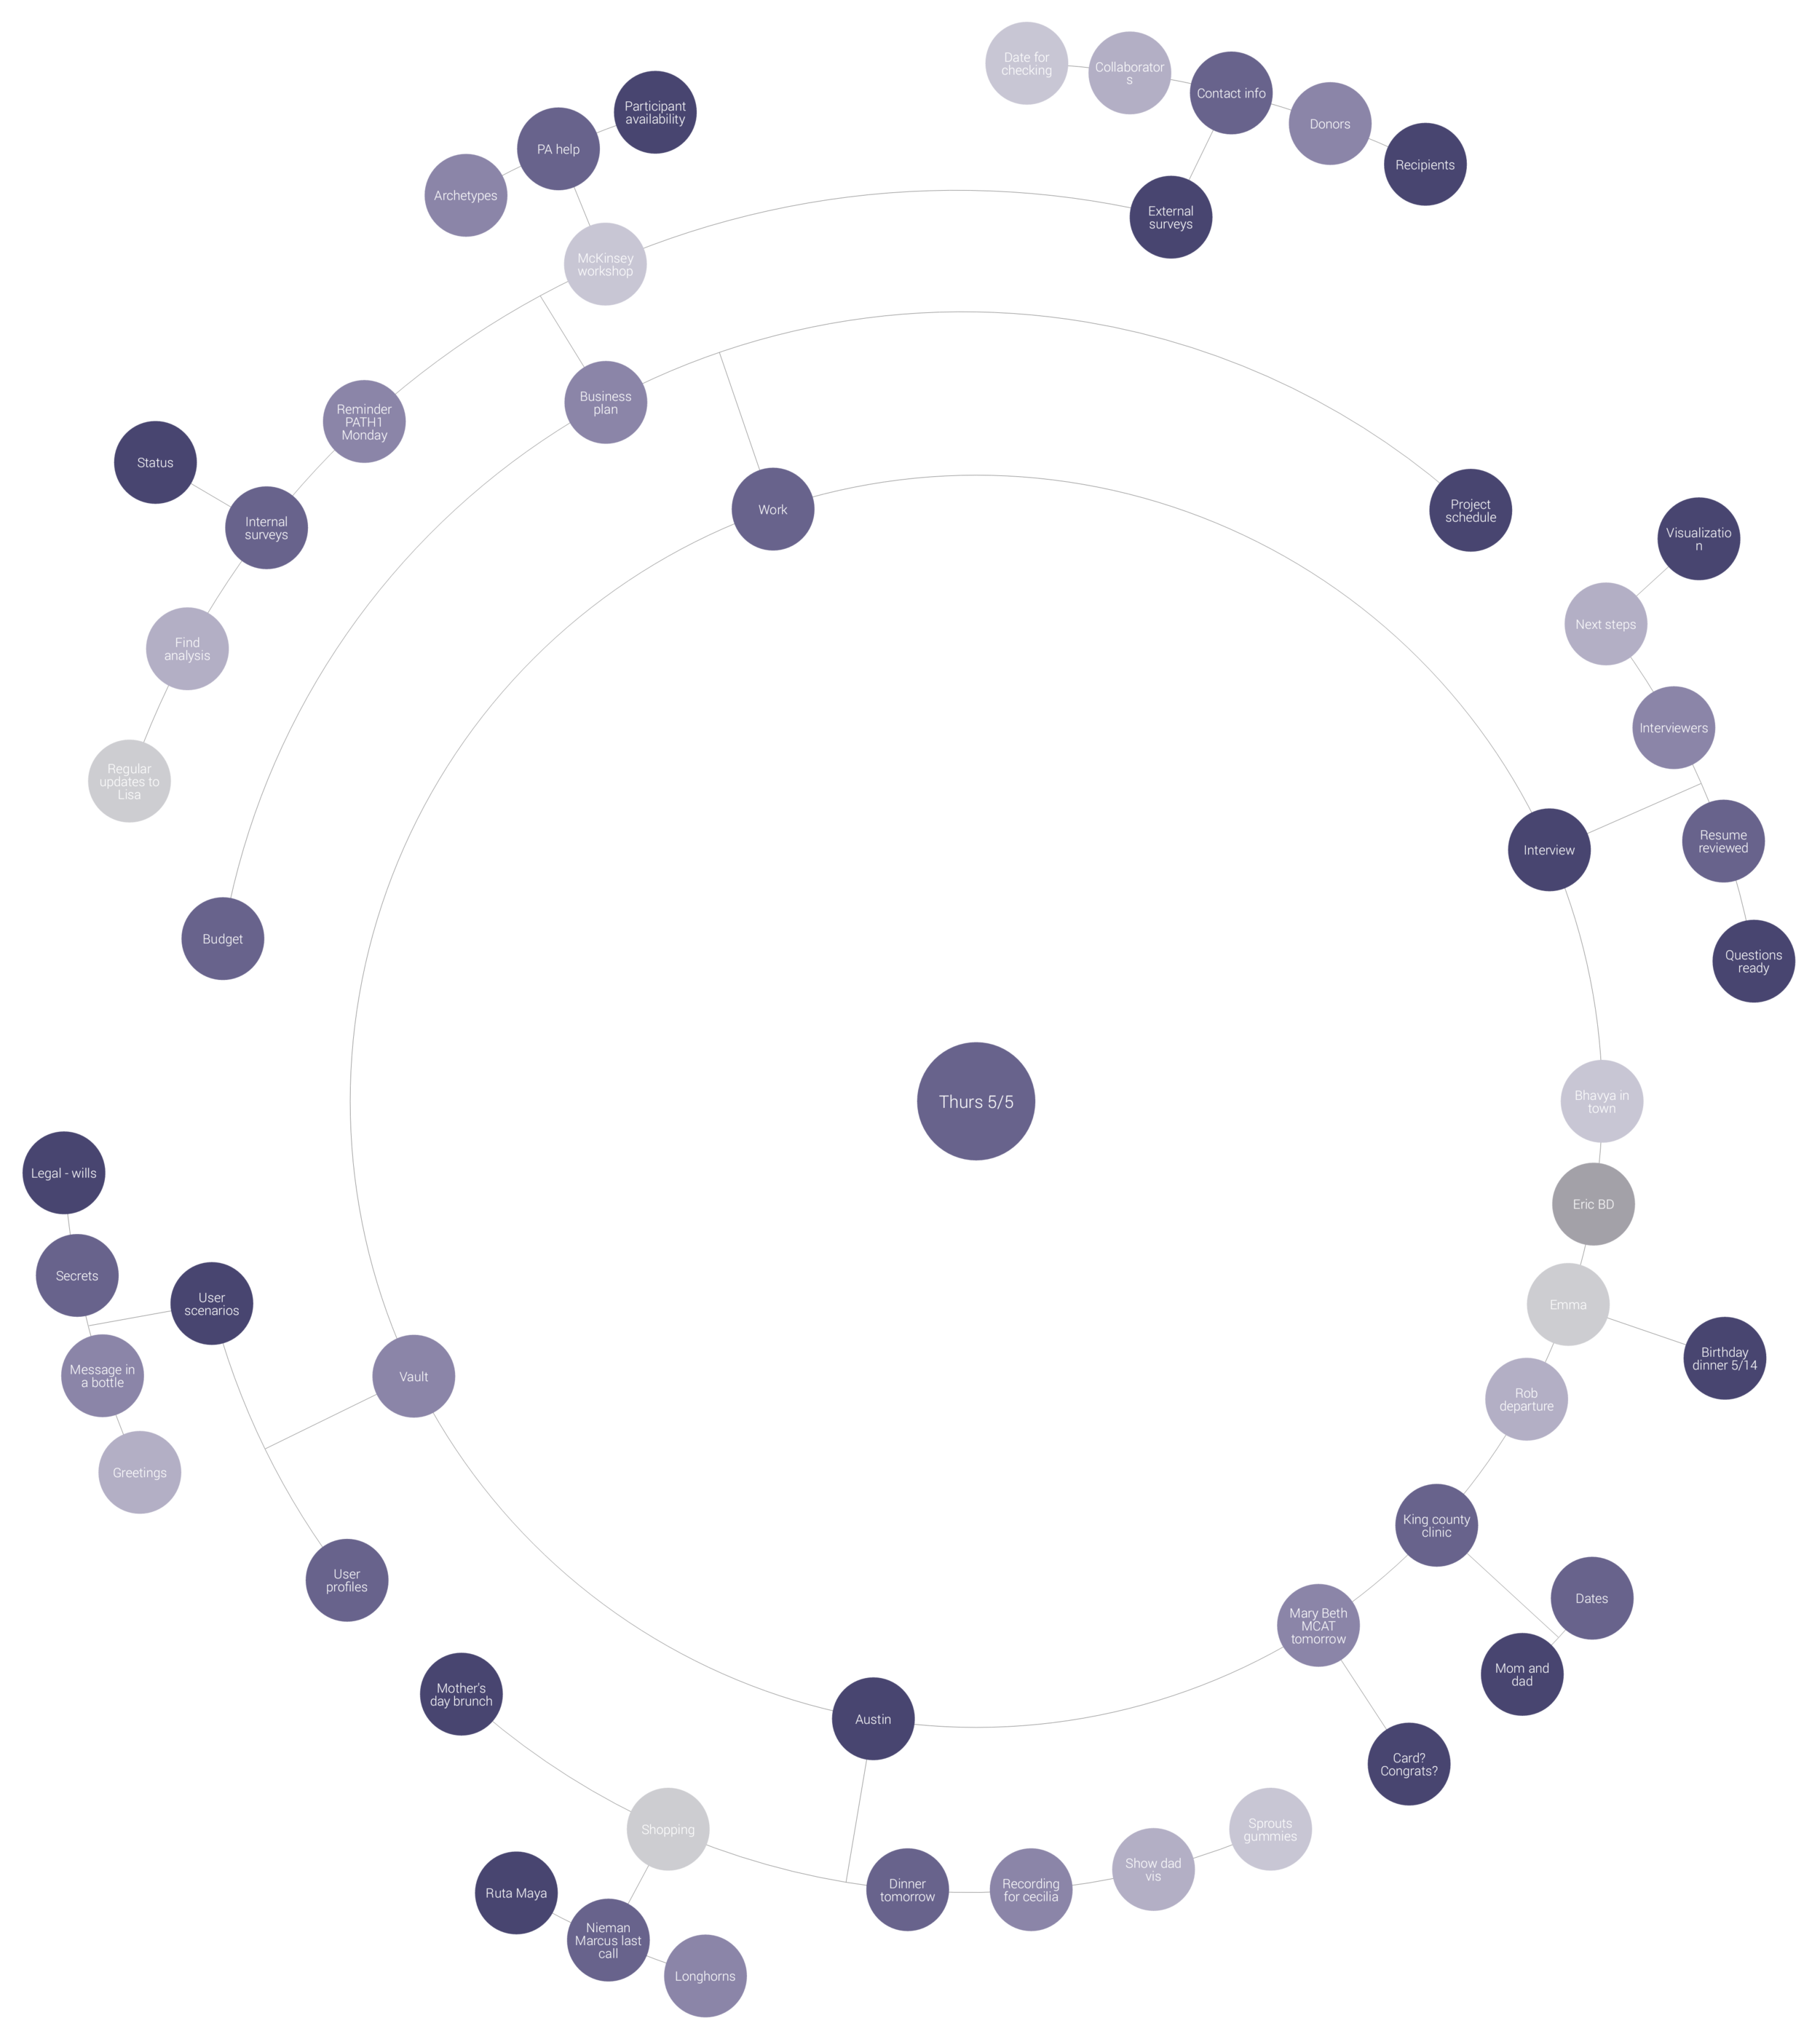
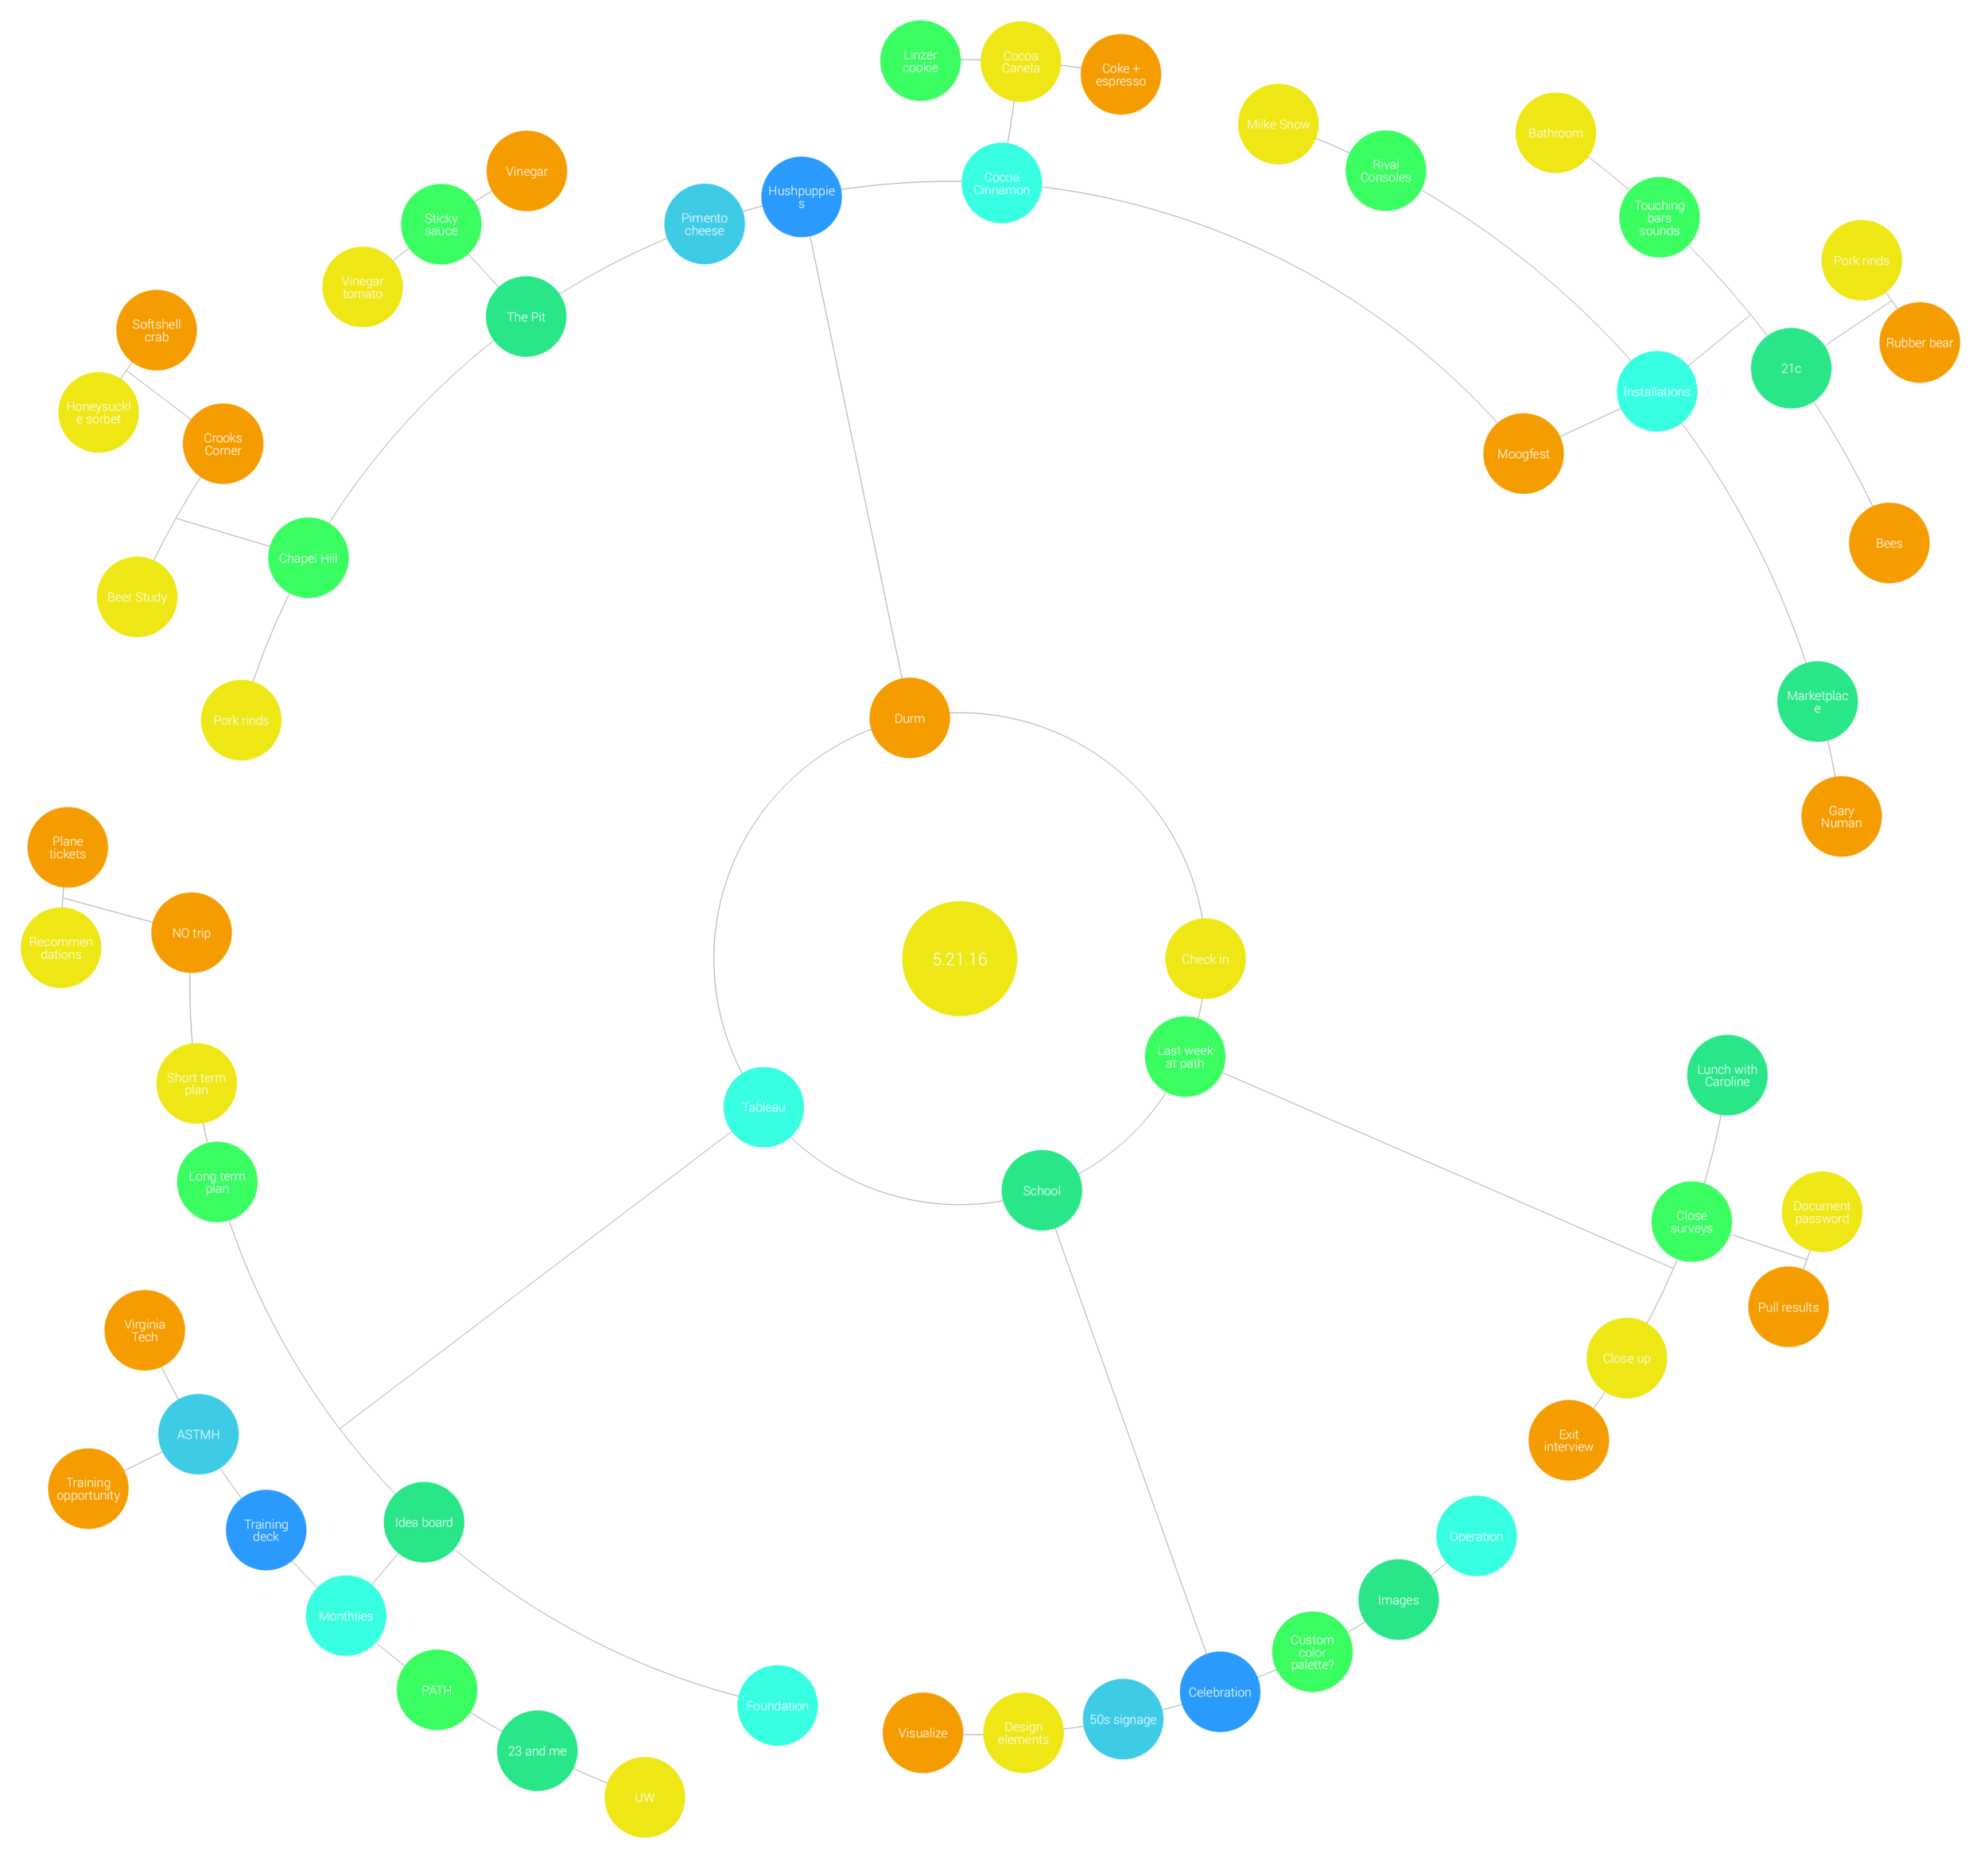
Which leads me to mind-mapping Fridays. Eager to get back to some sort of meditative activity, I chose to brain dump into an app I'd discovered called Mindly. Some folks have told me this looks like a big to-do list, but to me it's a really lovely visual way to see all of the things that are taking up cycles in my brain at that moment. In fact, in the couple of weeks I've done this, I haven't looked back at the map since creating it except to capture an image of it. The act of writing down my thoughts allowed me to acknowledge what was there - and then I could leave some of it behind. I still do a weekly to-do list, but mind-mapping allowed me to identify what was clutter and what was important.
Here are a couple of sample maps I've drawn, and they're naturally quite beautiful. I'm adding my mindmaps to a gallery on my site, just to see how I keep up this habit.
#Makeover Mondays
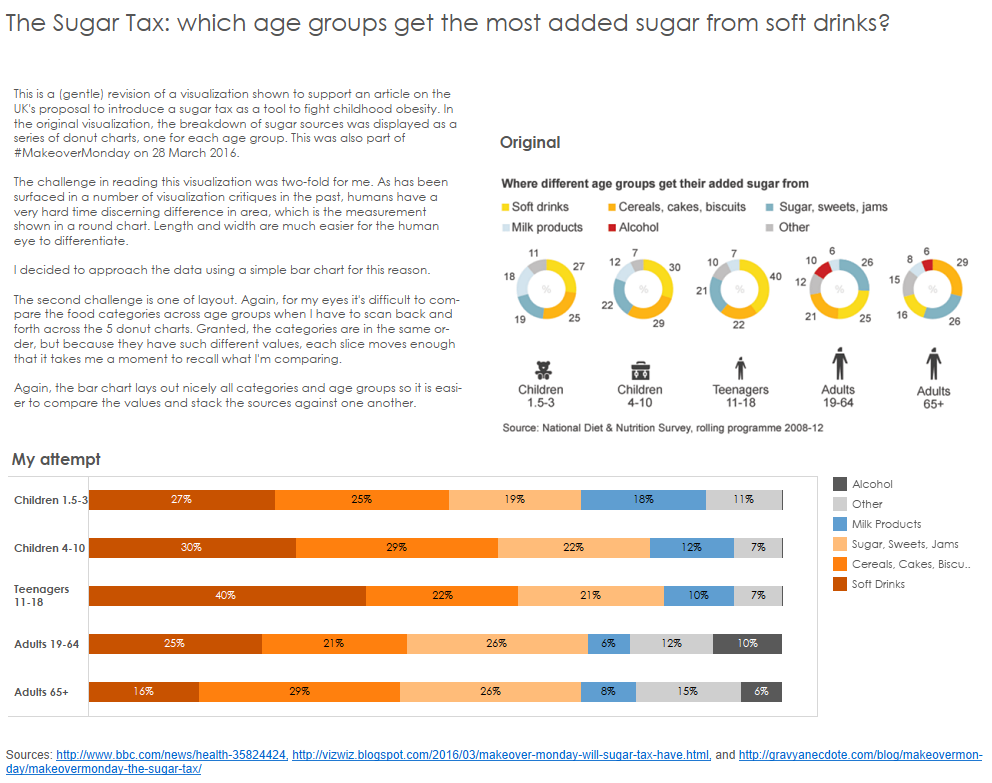
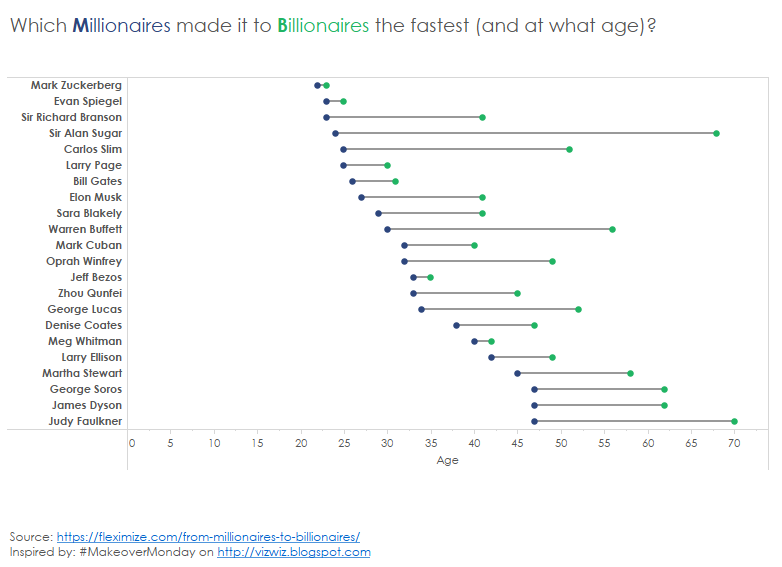
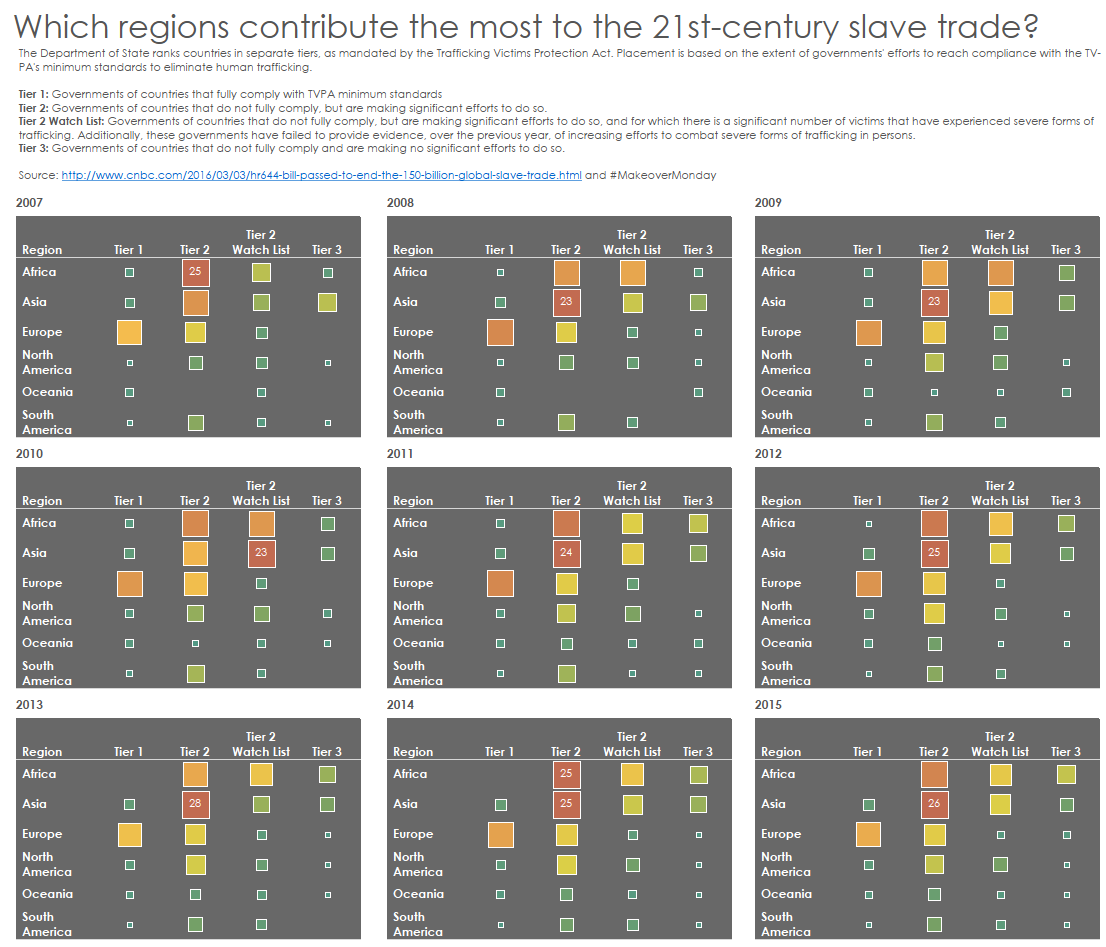
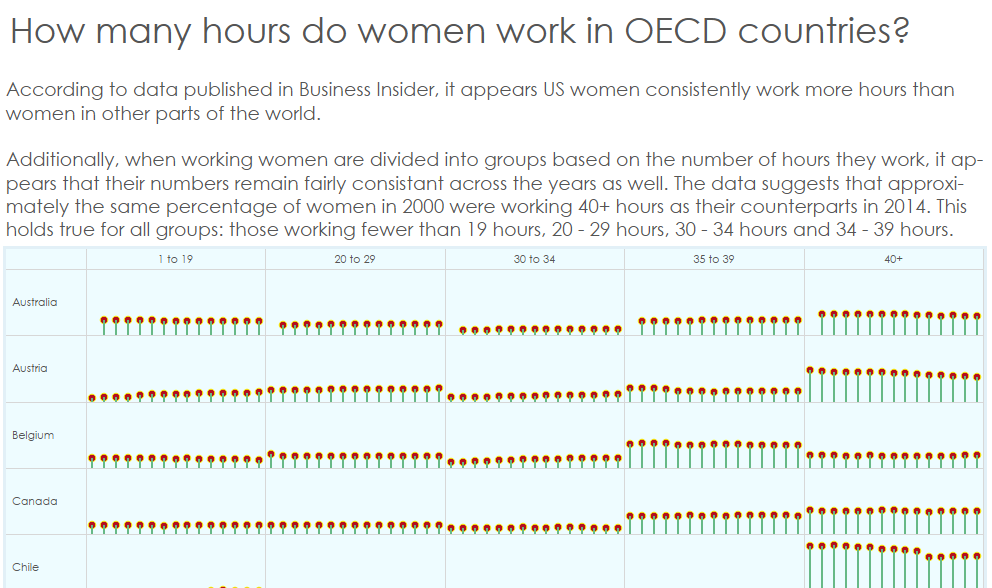
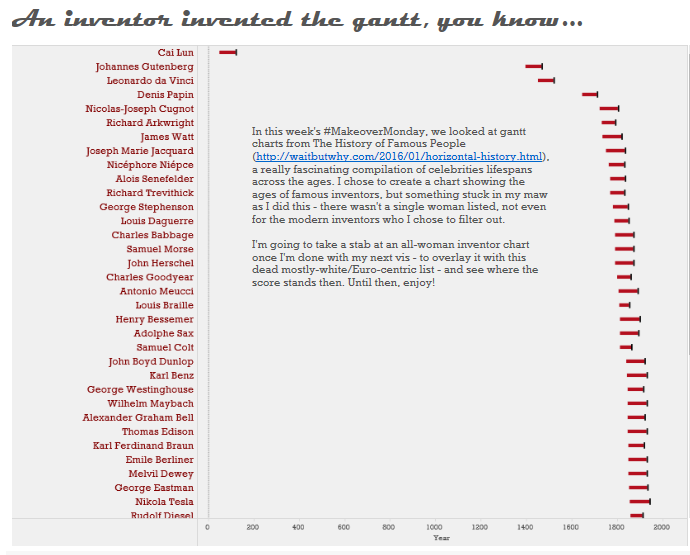
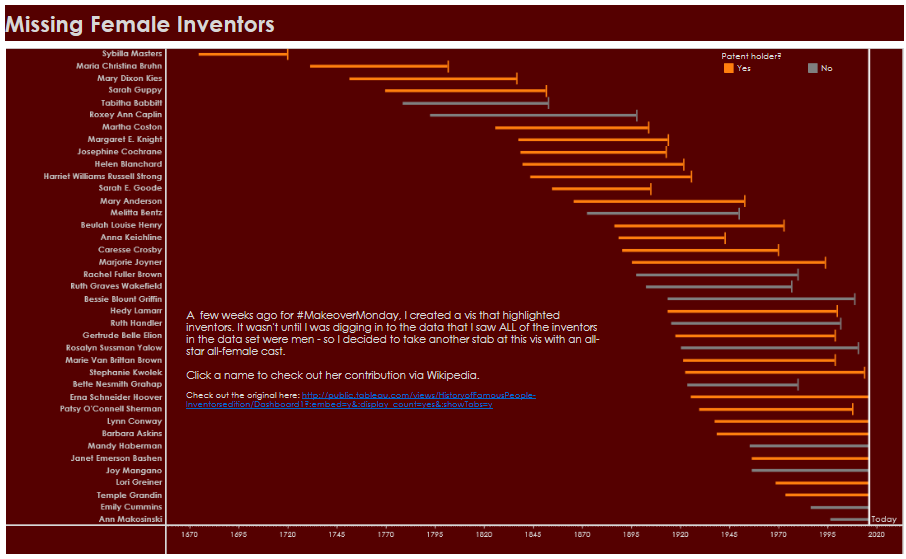
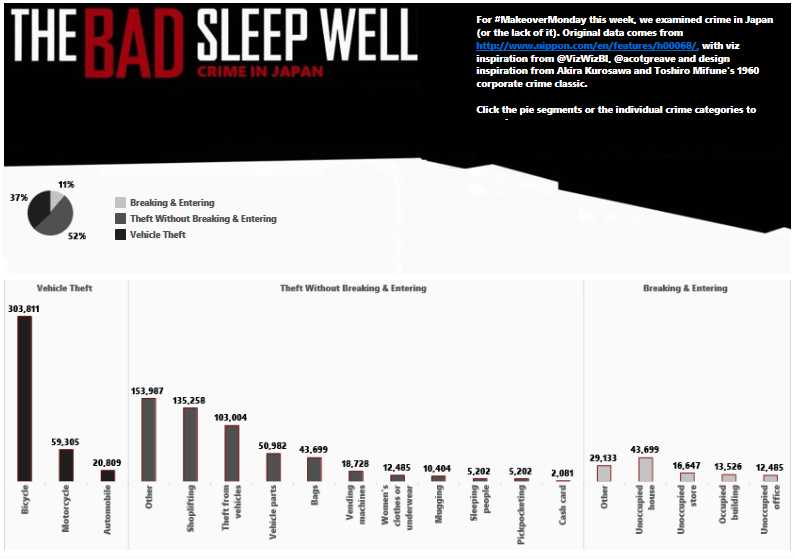
When I started my third UW course on data visualization, I quickly realized I was taking too long to create visualizations. I needed to be sharper and more directed about it - and needed to practice regularly. Enter Andy Kriebel's #MakeoverMonday challenge. Each Sunday he posts a vis challenge for the week, and encourages folks to participate - but to time box themselves so they don't noodle forever. I'm on my third makeover, and I give myself about an hour to complete the work. It's made me focus on the message of the original more carefully, and it's given me a practice forum to try new features I hadn't yet explored.
Other Projects
And of course, the projects don't stop coming. I'm trying to tease out opportunities to build data visualizations at work and in my volunteer life so I can keep learning and help others at the same time. A couple of things you will see soon:
- Public Health Reserve Corp's Annual volunteer survey
Visualizing survey data is slightly different than the data I've done before, so I was eager to chew through this when Dave Nichols offered it to me. - UW Data Vis Course 3 Capstone Project
This is to complete my certificate in Data Visualization at UW, and I'm drafting my capstone plans now. I'm thinking about examining micronutrient deficiencies for this project. - Egg Survey
We've been tracking egg production for our 4 chickens and I they seem to be on track for a very good year. - Diet Visualization
I've been trying to track my food intake and carb/fat/protein breakdown. It's been a long road, but I have a lot of data to consider and I might try to do something with this as well.
